INSIGHTS

Third Quarter 2023

After years of abnormally low interest rates, the Fed’s tough stance is intended to normalize the rate environment and prevent structurally engrained inflation

Most asset classes fell in the third quarter as investors faced higher oil prices, rapidly rising interest rates, and a strong dollar. Over the past three months, the US 10-year Treasury yield rose from 3.83% to 4.57%, while the price of crude oil climbed 33%. In September, the average 30-year fixed-rate mortgage rate reached 7.83% – its highest since 2000.

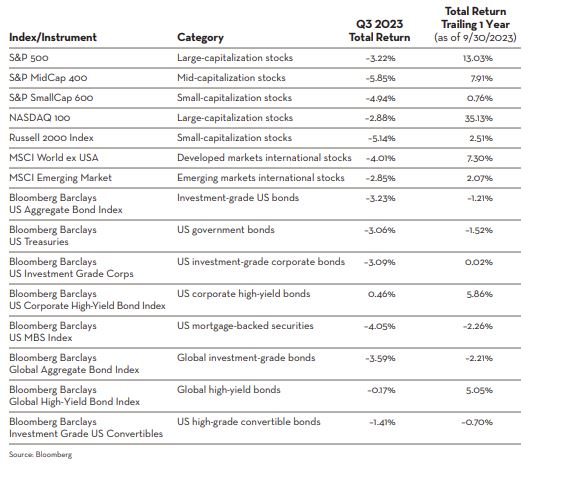
Early 2023 stock returns were fueled by the surge in the Technology sector, AI enthusiasm, and reduced expectations for inflation. Valuation multiples (P/E ratio) rose, lifting S&P 500 returns even though earnings growth declined. Investors are now digesting a higher cost of capital, pressuring valuations and returns for stocks of all sizes both in the US and abroad.

Better-than-expected economic data drove yields higher, sparking a selloff in bonds, pushing investment-grade bond returns into negative territory for the year. Yet, bond yields are now relatively more attractive for long-term investors, offering a real return over inflation.

Economic strength in the first half of the year was propelled by the auto sector, pent-up demand for services, corporate capital expenditures, and housing – all now slowing. In contrast, investors had numerous headwinds to overcome in the third quarter: higher yields, higher oil prices, a stronger dollar (which hurts US multinationals), and tighter bank lending standards.

The US labor market has been incredibly resilient. After losing nearly 22 million jobs in the spring of 2020, 25 million new jobs have been added. But payroll growth and wage gains have slowed over the past six months, with the lagged effect of the hiking cycle slowing labor growth as the Fed intended. Higher rates take time to infiltrate the economy, and the resulting atrophy doesn’t usually appear in all areas at once. Historically, the unemployment rate starts to rise 18-24 months after a hiking cycle starts, so we are just now entering the period when joblessness would be expected to begin to rise.

Consumption is expected to cool as student loan repayments resume and excess savings face exhaustion. Over the past four years, the US CPI Food Index is up 25% or about 6% annually. The savings rate (as a percentage of disposable income) has fallen to 3.5% from a pre-pandemic rate of 7.1%. While US consumers have been relentless spenders over the past two years, most have their limits and must make choices.

The Fed has made progress fighting inflation but will remain “data dependent”, analyzing monthly economic data before pausing their rate hiking campaign. After years of abnormally low interest rates, the Fed’s tough stance is intended to normalize the rate environment and prevent structurally engrained inflation. Their messaging indicates rates will stay at a heightened level well into 2024. Additionally, fiscal policy is out of sync with monetary policy. Investors are worried about government spending and deficits, with outlays well above pre-Covid levels, even though the unemployment rate is at historic lows. Massive treasury issuance is set to support a higher level of yields. The most significant risk to the economy is that the Fed pushes too far and destroys too much demand, or in other words, that higher yields break something in the economy. We remain cautious heading into the final quarter of the year as investors adjust to a different rate backdrop.


Disclosures

Tandem Wealth Advisors LLC (“Tandem”) is an SEC-registered investment adviser.

The information published herein is provided for informational purposes only and does not constitute an offer of investment advisory services. All information is subject to change without notice. Nothing contained herein constitutes financial, legal, tax, or other advice. No investment process is free of risk, and investors may lose all their investments. Past performance is not indicative of current or future performance and is not a guarantee. The opinions expressed in this document may not fit your risk and return preferences. The information provided is obtained from sources believed to be reliable, but we cannot attest to its accuracy. Past performance is not necessarily indicative of future returns.

Certain information contained herein constitutes “forward-looking statements,” which can be identified by the use of forward-looking terminology such as “may,” “will,” “should,” “expect,” “anticipate,” “project,” “estimate,” “intend,” “continue,” or “believe,” or the negatives thereof or other variations or comparable terminology. Due to various risks and uncertainties, actual events, results, or actual performance may differ materially from those reflected or contemplated in such forward-looking statements. Nothing contained herein may be relied upon as a guarantee, promise, assurance, or a representation of future events or conditions.

Additional copies of Tandem’s ADV Part 2A and/or Privacy Policy are available upon request by phone at 602-297-8600 or by email at [email protected].

Index Definitions

The S&P 500 Index measures the performance of the large-cap segment of the US equity market. The S&P MidCap 400 Index measures the performance of the mid-cap segment of the US equity market. The S&P SmallCap 600 Index measures the performance of the small-cap segment of the US equity market. The Nasdaq 100 is a basket of the 100 largest, most actively traded US companies listed on the Nasdaq stock exchange. The Russell 2000 Index measures the performance of the small-cap segment of the US equity market. The MSCI World Ex USA Index captures large- and mid-cap representation across 22 of 23 developed markets countries, excluding the US. The MSCI Emerging Markets Index captures more than 1,400 large- and mid-cap securities in 24 countries spanning across five regions. The Bloomberg Barclays US Aggregate Bond Index is a broad-based benchmark that measures the investment-grade, US dollar-denominated, fixed-rate taxable bond market. The Bloomberg Barclays US Treasuries Index includes public obligations of the US Treasury, i.e., US government bonds. The Bloomberg Barclays Investment Grade Corporates index measures the investment-grade, fixed-rate, taxable corporate bond market. The Bloomberg Barclays Corporate High Yield Index measures the USD-denominated, highyield, fixed-rate corporate bond market. The Bloomberg Barclays US MBS Index measures the performance of US mortgagebacked fixed income securities. The Bloomberg Barclays Global Aggregate Bond Index tracks the performance of global investment-grade, fixed-rate bond markets. The Bloomberg Barclays Global High Yield Bond Index is a multi-currency measure of the global high yield corporate debt market. The Bloomberg Barclays Investment Grade US Convertibles Index tracks the performance of investment-grade, USD-denominated convertible securities. S&P 500 Sectors measure segments of the US stock market as defined by GICS®. All index performance data sourced from Bloomberg.

Scroll to Top