
Market Summary
- Exceptionally strong earnings growth drove the S&P 500 2.03% higher in the quarter, with the next twelve months’ earnings growth expected to approach 40%.
- The spike in oil prices and interest rates led the market Price/Earnings (P/E) multiple meaningfully lower in the quarter.
- While large-company stocks advanced, mid- and small-company stocks declined as rising oil prices, interest rates, and inflation concerns increased pressure on more cyclical areas of the market.
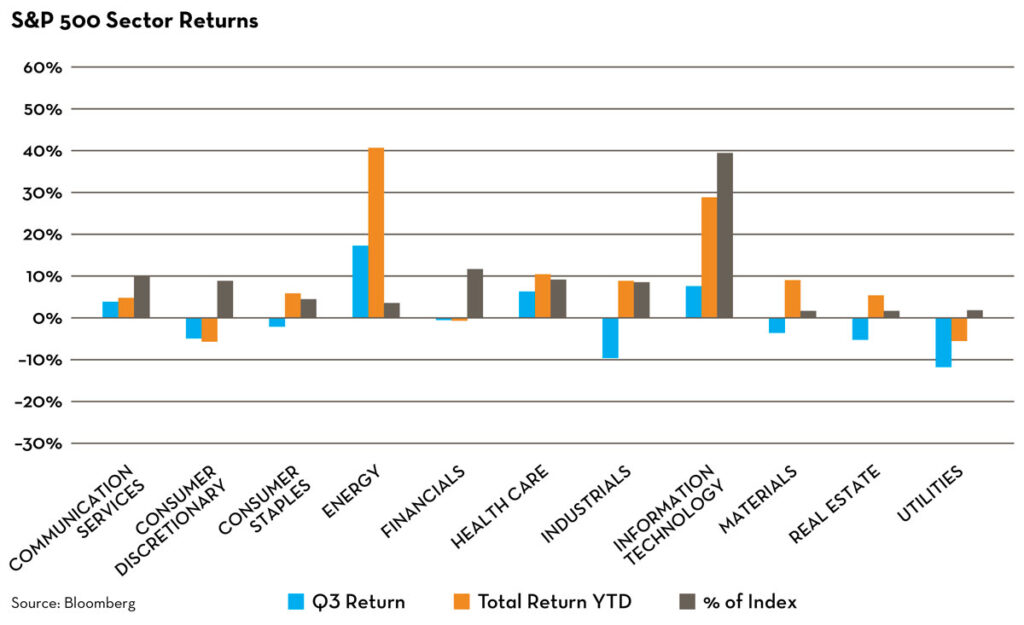
- Energy emerged as the clear sector leader in the third quarter amid rising oil prices. Technology and Healthcare also ranked among the quarter’s top performers.
- Bond returns fell as interest rate normalization continued. Yields are becoming increasingly attractive after over two decades of financial suppression (near-zero interest rate policy).
Top Themes of the Third Quarter 2026
- Rising oil prices and higher-than-expected inflation readings pushed the Federal Reserve toward tighter policy, unanimously moving to raise interest rates for the first time since 2023. Increasing government need (fiscal policy, Iran war, tariff policy) and corporate need (AI buildout) for capital is driving real interest rates.
- Higher rates have not been exclusively a US phenomenon, with Europe and Japan seeing yields at their highest levels in nearly two decades. Most major regions around the world have experienced a significant rise in interest rates, along with corresponding declines in stock valuations. China is a clear anomaly, with lower rates reflecting weak domestic demand.
- Investor concerns about AI remain heightened around four main issues:
- the level of AI spending and corresponding returns on investment,
- AI-related layoffs,
- the pace and safety of frontier-model development, and
- the environmental and infrastructure demands of data-center expansion, including electricity consumption, water use, and pressure on local power grids.
- Rising gasoline prices and mortgage rates have squeezed household budgets, making housing and everyday expenses feel increasingly unaffordable to many Americans.

Top Themes of the Third Quarter 2026
- Equity markets have responded to higher interest rates by re-rating stocks with a lower overall P/E multiple of roughly 19x from a recent high of 22x. Yet the outlook for positive returns remains constructive because of strong expected earnings growth over the next year led by the Technology and Energy sectors.
- Interest rates are normalizing after over two decades of near-zero interest rate policy, driven mostly by strong economic growth. Markets are expecting one more Fed increase this year. As a result, the housing sector will likely remain soft, while patient savers and investors are rewarded in this higher-yielding environment. A continuous sharp rise in rates is the main risk to equity markets looking forward.
- AI’s long-term impact on jobs and productivity is expected to be considerable, yet today, not completely known. Despite this risk, we expect investment in the theme to fuel the current borrowing boom. This year, four of the biggest US tech companies (MSFT, AMZN, META, GOOGL) will spend around $650 billion collectively on data centers, networking equipment, and other infrastructure needed to achieve their AI ambitions.
As always, adherence to your long-term investment plan is the key to meeting your financial objectives as the market cycle evolves and geopolitical risks continue to impact the investing backdrop.